Analytics
See where installations slow down, and why
When coordination lives in inboxes and spreadsheets, the only performance metric is how loud the complaints get. Done records every event on every job, so you can see where installations stall, which installers deliver and what each job actually earned.
One record per job
Every job event, structured and queryable
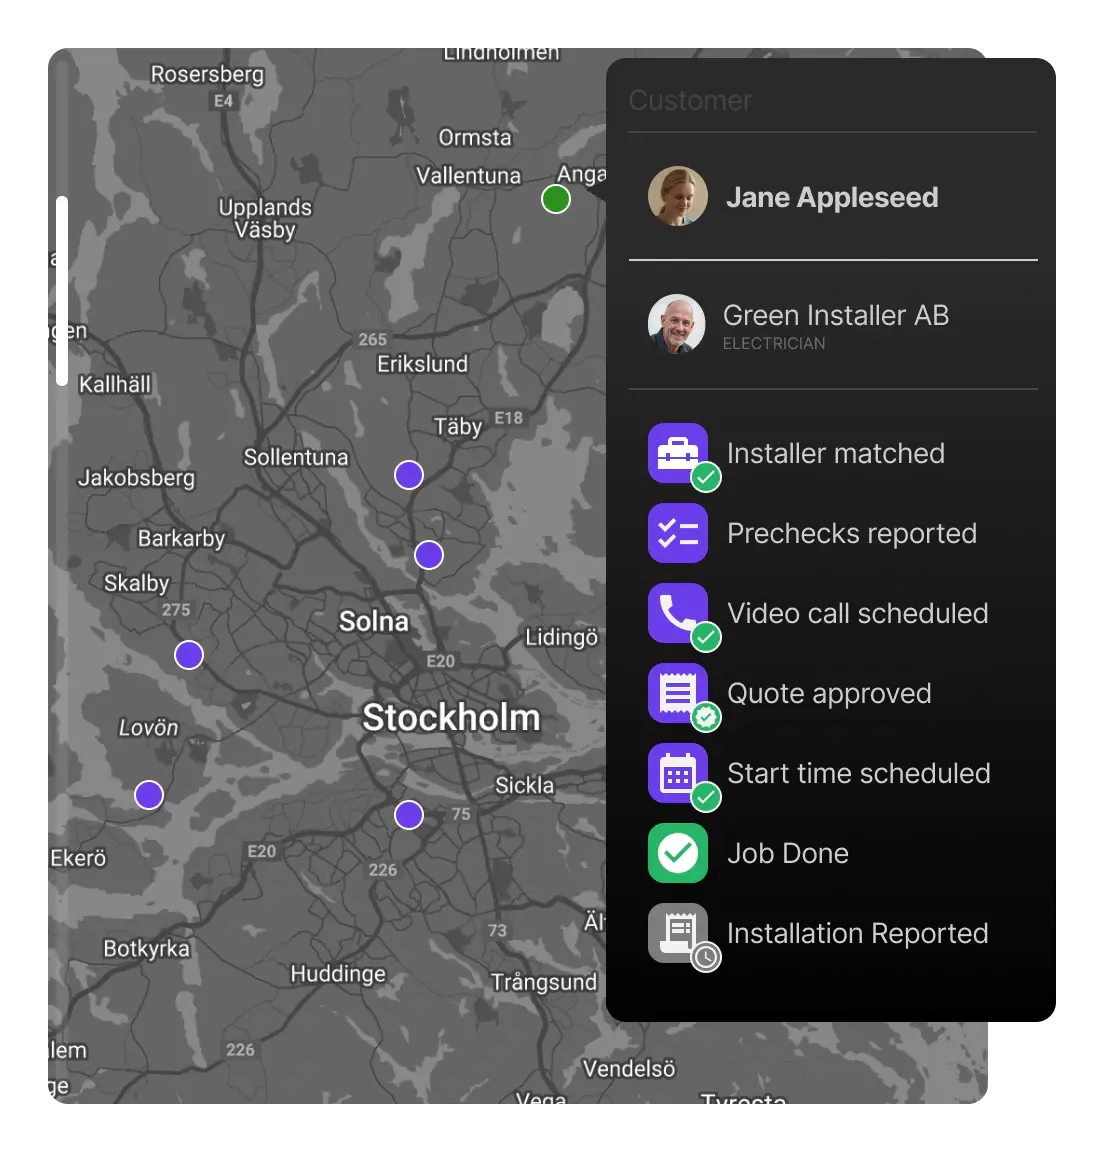
Each order writes a structured event log as it moves: created, matched, scheduled, quoted, completed, invoiced, reviewed. Status changes, messages, quotes and invoices land in the same record, stored in BigQuery. No number depends on someone remembering to update a tracker.
- Timestamps for each step: time to match, to schedule, to complete
- Financial events on the same job record as operational ones
- Ratings and reviews tied to the installer who did the work
Questions you can answer without a spreadsheet
Dashboards for your operations team and your partners, built on the same event data.
Lead times
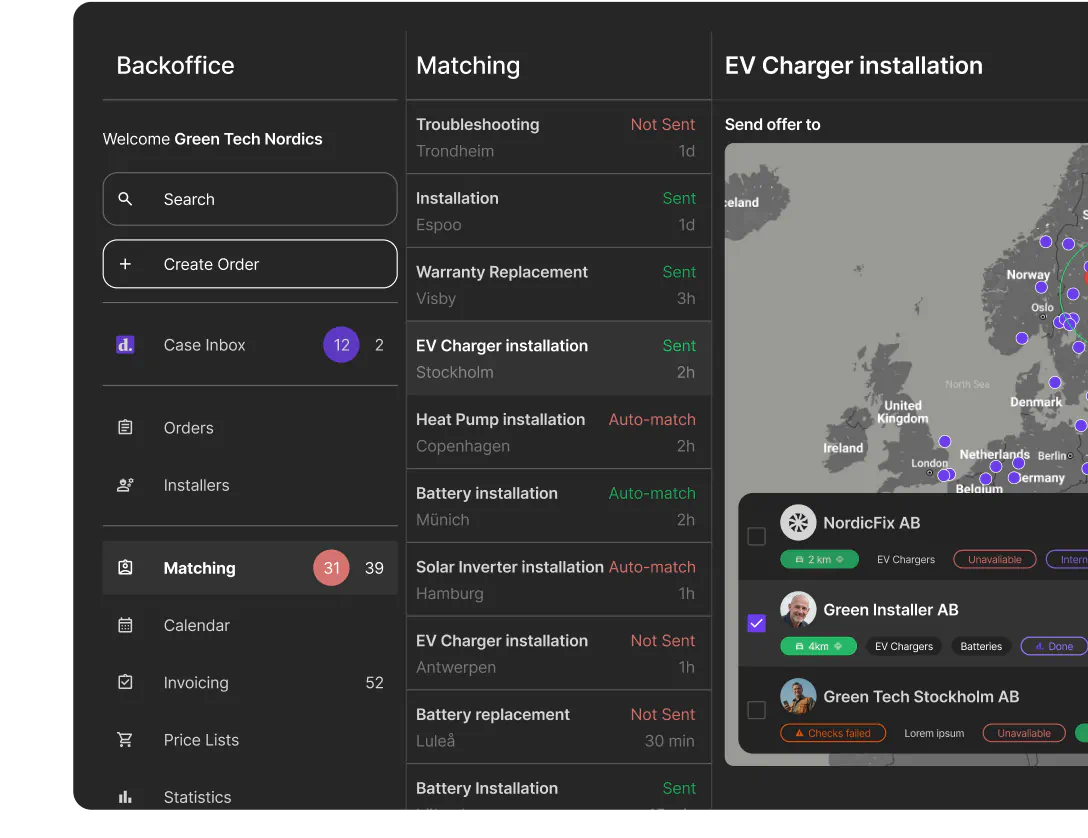
Where do jobs stall? Time from order to match, match to schedule and schedule to completion, by region and job type.
Installer performance
Ratings, completion rates and response times per installer company, whether it is your own crew, a subcontractor or the Done network.
SLA tracking
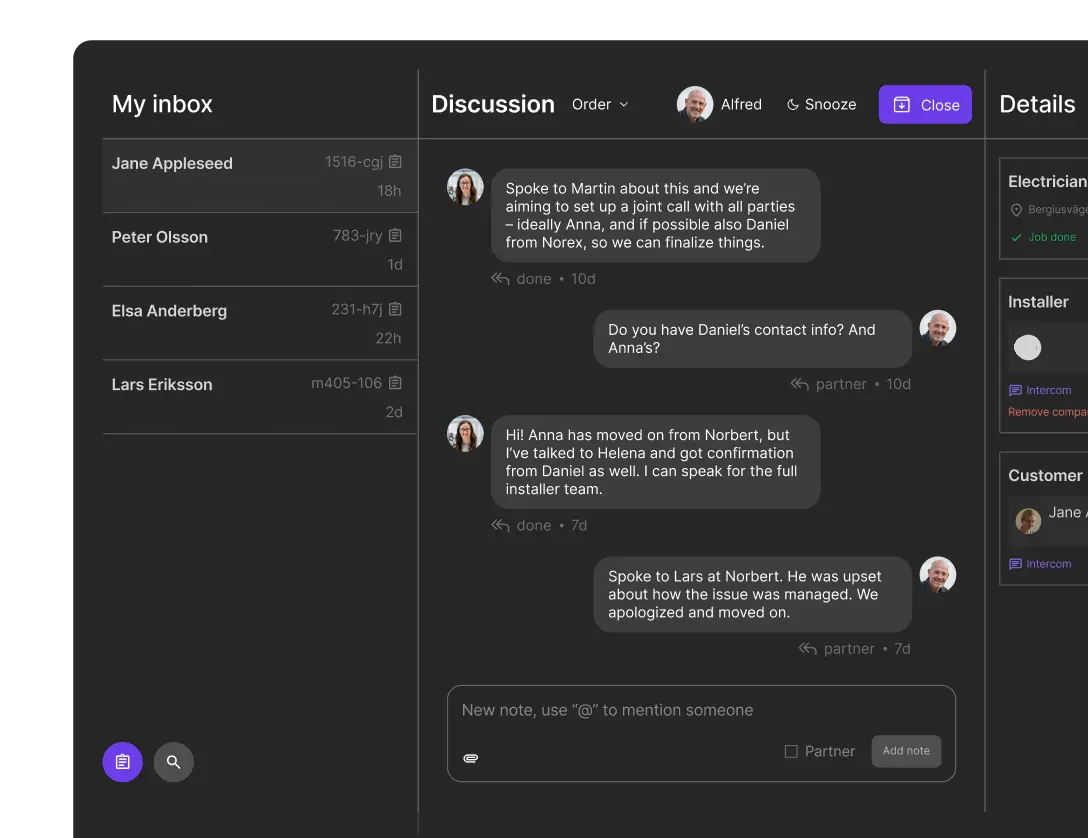
Follow adherence to your service levels. Jobs that drift are flagged in Done Inbox before the customer notices.
Profit per job
Quoted extras, approved costs and invoices roll up per job, installer and product type.
Partner dashboards
Each retail partner gets its own view of volume, quality and status, limited to its own data.
CSV and BI export
Export any view to CSV, or feed your own data warehouse and BI tools from the BigQuery event log.
From numbers to action
Catch problems while you can still fix them
Ratings follow the installer, so you can see who delivers consistently and step in when quality slips. Stalled jobs show up in Done Inbox while there is still time to act. When complaints cluster, you trace them to a cause with the full job timeline in hand.
- Stalled jobs flagged automatically, not found in a weekly meeting
- Complaints investigated with the whole job timeline attached
- Capacity planning based on real regional volumes
Frequently asked questions
See your operation in numbers
We'll show you the dashboards on real workflows: lead times, installer performance and profit per job.
Contact sales